matplotlib Part III: seaborn
seaborn
import numpy as np
import pandas as pd
import matplotlib as mpl
import matplotlib.pyplot as plt
import seaborn as sns # seaborn convention
seaborn styles
mpl provides a number of plotting styles
mpl.style.use('seaborn-v0_8-bright')
mpl.style.available
['Solarize_Light2',
 '_classic_test_patch',
 '_mpl-gallery',
 '_mpl-gallery-nogrid',
 'bmh',
 'classic',
 'dark_background',
 'fast',
 'fivethirtyeight',
 'ggplot',
 'grayscale',
 'seaborn-v0_8',
 'seaborn-v0_8-bright',
 'seaborn-v0_8-colorblind',
 'seaborn-v0_8-dark',
 'seaborn-v0_8-dark-palette',
 'seaborn-v0_8-darkgrid',
 'seaborn-v0_8-deep',
 'seaborn-v0_8-muted',
 'seaborn-v0_8-notebook',
 'seaborn-v0_8-paper',
 'seaborn-v0_8-pastel',
 'seaborn-v0_8-poster',
 'seaborn-v0_8-talk',
 'seaborn-v0_8-ticks',
 'seaborn-v0_8-white',
 'seaborn-v0_8-whitegrid',
 'tableau-colorblind10']
exhibition of available matplotlib styles
Basic Linear Model Plots
seaborn.lmplot(data, *, x=None, y=None, hue=None, col=None, row=None,
              palette=None, col_wrap=None, height=5, aspect=1,
              markers='o', sharex=None, sharey=None,
              hue_order=None, col_order=None, row_order=None,
              legend=True, legend_out=None,
              x_estimator=None, x_bins=None, x_ci='ci', scatter=True, fit_reg=True,
              ci=95, n_boot=1000, units=None, seed=None, order=1,
              logistic=False, lowess=False, robust=False, logx=False,
              x_partial=None, y_partial=None, truncate=True,
              x_jitter=None, y_jitter=None,
              scatter_kws=None, line_kws=None, facet_kws=None)
# data
num_points = 100
gradient = .5
x = np.array(range(num_points))
y = np.random.randn(num_points)*10 + x*gradient

data = pd.DataFrame({'dummy x':x, 'dummy y':y

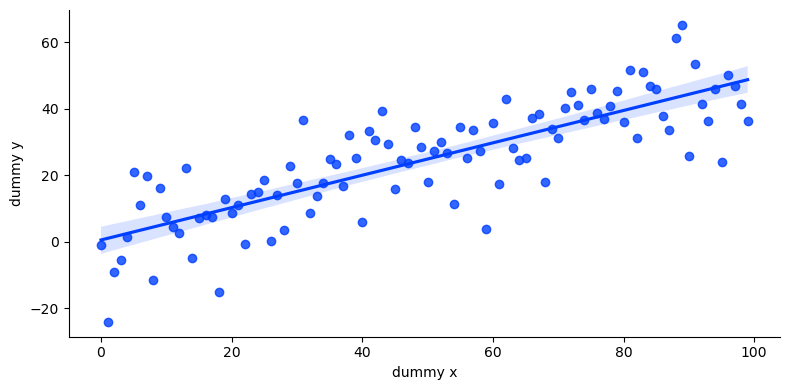
# linear regression plot with seaborn
sns.lmplot(data=data, x='dummy x', y='dummy y',
          height=4, aspect=1)
plt.tight_layout # seaborn shares pyplot global context
plt.savefig('chart.png', dpi=200)
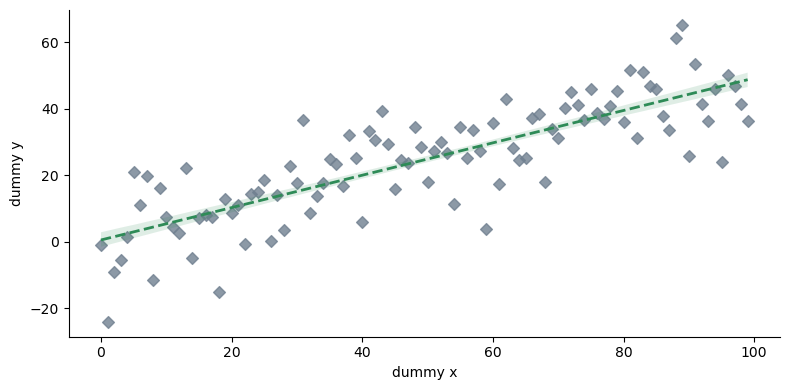
# changing standard error estimate to 68% instead of 95
sns.lmplot(data=data, x='dummy x', y='dummy y',
          scatter_kws={'color': 'slategray'},
          line_kws={'linewidth':2, 'linestyle':'--',
                    'color':'seagreen'},
          markers='D', ci=68)
FacetGrids
class seaborn.FacetGrid(data, *, row=None, col=None, hue=None,
                      col_wrap=None, sharex=True, sharey=True, height=3, aspect=1,
                      palette=None, row_order=None, col_order=None,
                      hue_order=None, hue_kws=None,
                      dropna=False, legend_out=True, despine=True,
                      margin_titles=False, xlim=None, ylim=None,
                      subplot_kws=None, gridspec_kws=None)
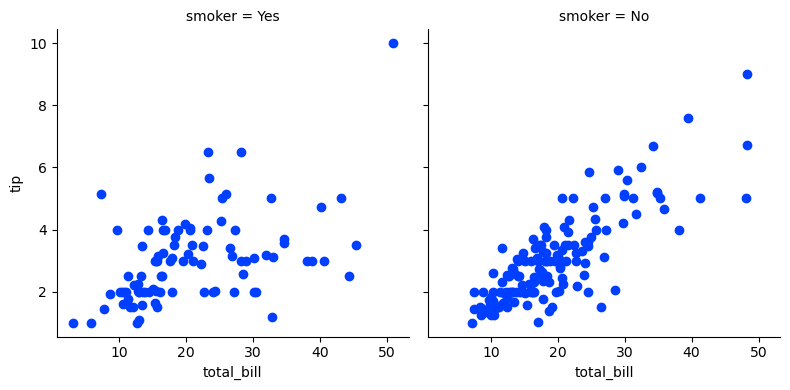
FacetGrids enable plotting multiple instances of the same plot on different subsets of dataset.
tips = sns.load_dataset('tips')
tips
	total_bill	tip	sex	smoker	day	time	size
0	16.99	1.01	Female	No	Sun	Dinner	2
1	10.34	1.66	Male	No	Sun	Dinner	3
2	21.01	3.50	Male	No	Sun	Dinner	3
3	23.68	3.31	Male	No	Sun	Dinner	2
4	24.59	3.61	Female	No	Sun	Dinner	4
...	...	...	...	...	...	...	...
239	29.03	5.92	Male	No	Sat	Dinner	3
240	27.18	2.00	Female	Yes	Sat	Dinner	2
241	22.67	2.00	Male	Yes	Sat	Dinner	2
242	17.82	1.75	Male	No	Sat	Dinner	2
243	18.78	3.00	Female	No	Thur	Dinner	2
244 rows × 7 columns

g = sns.FacetGrid(tips, col='smoker', height=4, aspect=1)
# map takes a plot class, scatter, and two dimensions for the plot
g.map(plt.scatter, 'total_bill', 'tip')
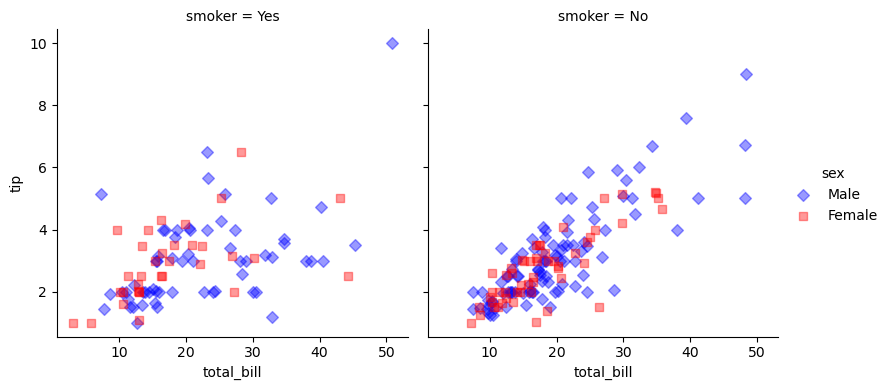
pal = dict(Female='red', Male='blue')
g = sns.FacetGrid(tips, col='smoker',
                  hue='sex', hue_kws={'marker=['D', 's']},
                  palette=pal, height=4, aspect=1)
g.map(plt.scatter, 'total_bill', 'tip', alpha=.4)
g.add_legend()
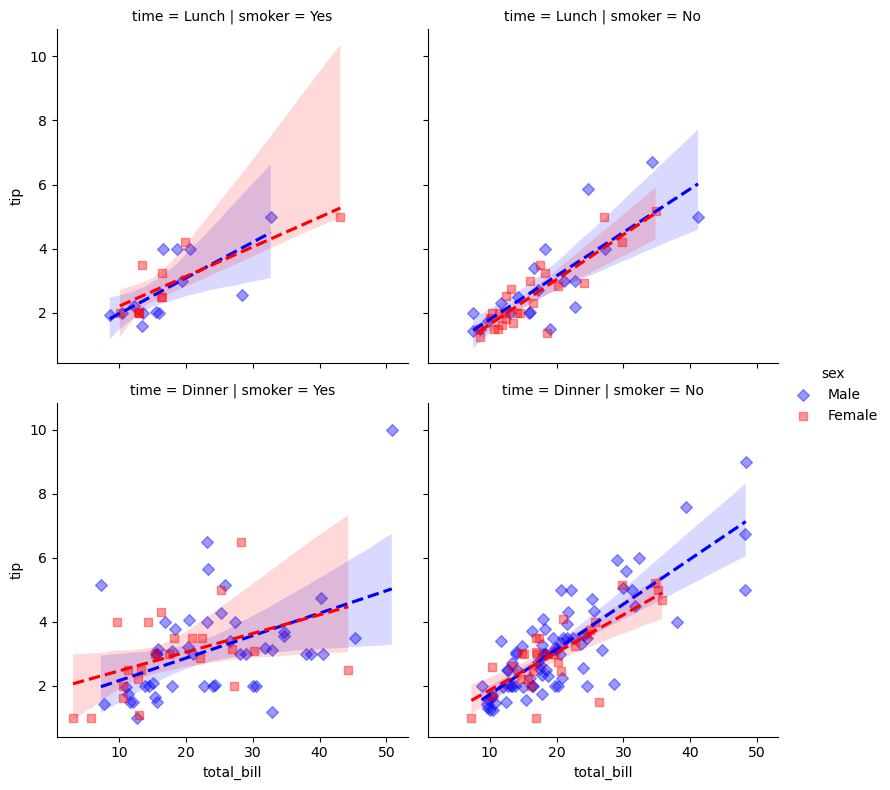
pal = dict(Female='red', Male='blue')
g = sns.FacetGrid(tips, col='smoker', row='time',
                  hue='sex', hue_kws={'marker':['D', 's']},
                  palette=pal, height=4, aspect=1)
g.map(sns.regplot, 'total_bill', 'tip' scatter_kws={'alpha':.4}, line_kws={'linestyle':'--'})
g.add_legend()
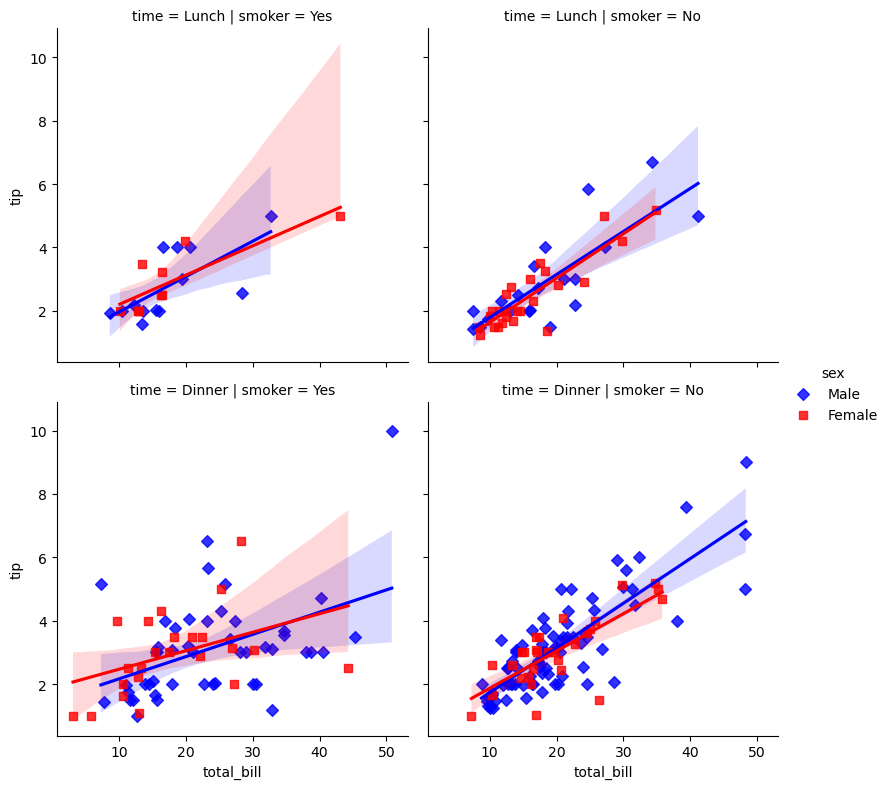
lmplot achieves the same effect as FacetGrid and regplot.
pal = dict(Female='red', Male='blue')
sns.lmplot(x='total_bill', y='tip', hue='sex',
          markers=['D', 's'],
          col='smoker', row='time', data=tips, palette=pal,
          height=4, aspect=1)
PairGrids
class seaborn.PairGrid(data, *, hue=None, vars=None,
                      x_vars=None, y_vars=None,
                      hue_order=None, palette=None, hue_kws=None,
                      corner=False, diag_sharey=True,
                      height=2.5, aspect=1, layout_pad=0.5,
                      despine=True, dropna=False)
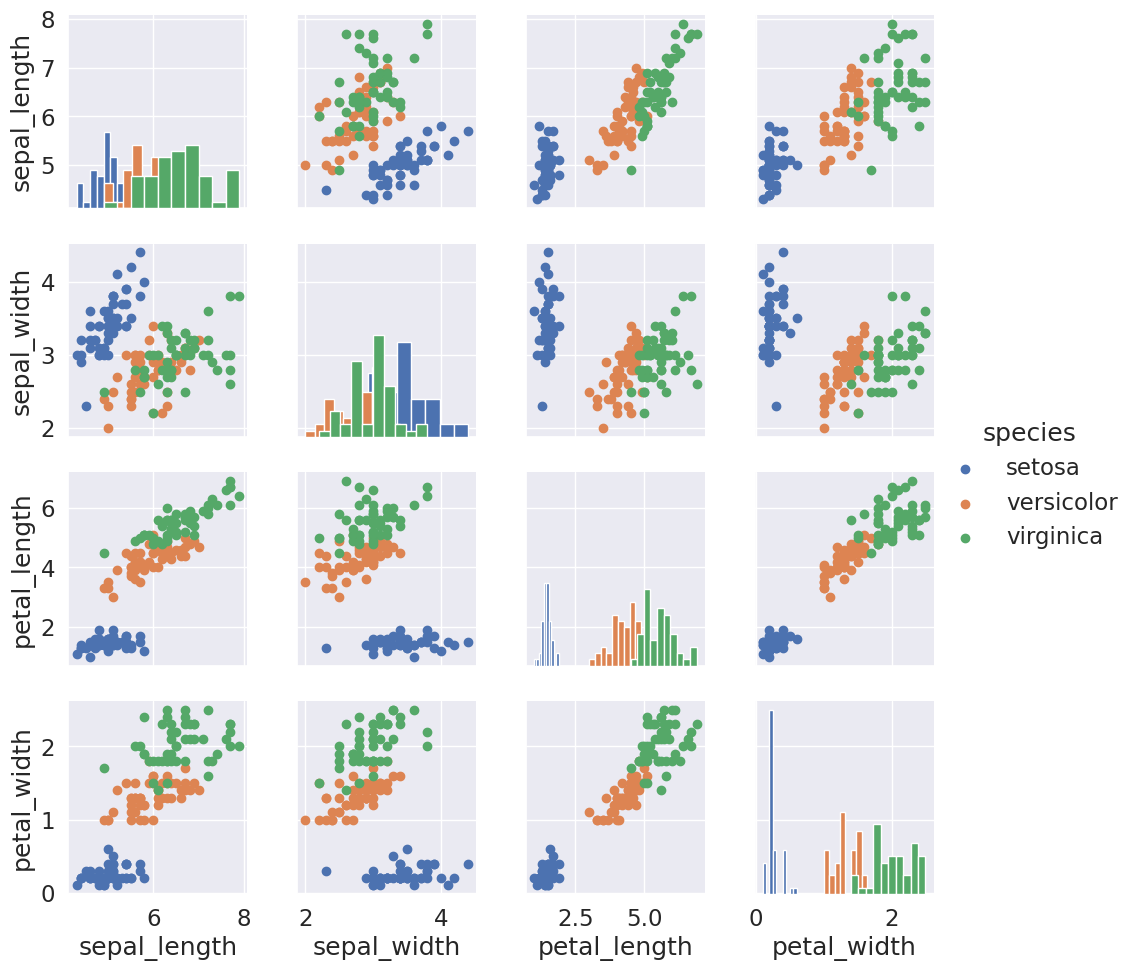
iris = sns.load_dataset('iris')
sns.set_theme(font_scale=1.5)
g = sns.PairGrid(iris, hue='species')
g.map_diag(plt.hist)
g.map_offdiag(plt.scatter)
g.add_legend()

